
Chasing Teacher Morale in Conroe ISD
A deep-dive into OHI and its impact on teachers.


Growing up on a ranch in Latexo, TX, my jobs as a teenager included working gardens, building fences, tearing down old barns, bailing hay, chunking watermelons onto a trailer, and a plethora of odd jobs that hurt my back just thinking about it. The country life does not take time to understand your feelings on the work you do. Neither did McDonalds when I started working the counter and cleaning bathrooms. Just don’t sneak French fries and management will leave you alone.
As you get older and fall into professional roles, you may find that working with people can become more challenging than the things you are tasked to do (unless people are your job). As human beings, we have very complex social interactions between each other, and from within our hierarchies such as the places we work. Understanding how to navigate these interactions is a never-ending process, as people must grow and develop both their skills and their ability to work with (or lead) others. This is when where you work becomes equally as important as the work you do, as your environment can either positively develop you, send you to a dead end, or drive your mental health to a breaking point.
Work Satisfaction
How satisfied are you with your job? Every few years I take part in our company’s different employee surveys. These surveys are focused, well-researched, and can help inform our leadership teams with information on where we are strong or where we need to improve as a company. It can range from employee satisfaction on our work location or ‘work from home’ policy, to our impact on the environment, or how we feel about diversity and inclusion programs, as well as questions regarding our happiness with career progression and opportunity within the organization. This data becomes a source of pride for the company and is a great way to field complaints or suggestions for improvement.
Employee surveys are fairly common in both the private and public sectors. Good leaders want to know how workers feel about their work and if they find purpose in their job role. Without this information, issues can creep up behind the scenes, not giving management enough time to correct things before it escalates and is more difficult to address. However, even with employee satisfaction data, some companies are slow to move, or they make no changes at all.
The reality is that you need more data than just ‘job satisfaction’. You need to understand the why things may be the way they are. Surveys must encompass areas beyond happiness and try to find the reasons people feel the way they do. If worker morale is low, what are the contributing factors causing that? How do we figure that out in a way that is accurate and gives us the data on where we should focus?
You also need this data to improve development of your local leaders, giving them the information they need to do their jobs as managers, coaching them where they need improvement as well.
Pivoting to our topic, teachers within public education, the challenge of understanding work satisfaction becomes even more complex, as there are external factors that constantly impact their ability to do their work. These things can be completely out of the control or influence of the school district (e.g., Texas politics). Yet, there are individual schools that show very high satisfaction numbers, and those that do not.
Teacher Morale
Let us first start with why we are discussing teacher morale.
If you read the depressingly common story from the most wonderful person in my life, Denise, then you’ll know that we have an interest to understand teacher morale within CISD. The reason for this is that she was a teacher at a particular school for over a decade, and the perception by staff was that the local leadership was not as effective as it should be. In fact, it was quite the opposite. The number of stories we collected about this school would rival the length of this write-up. Suffice to say that many teachers have not enjoyed working there, and it results in heavy turnover year over year. Yet leadership change has not occurred, at least not in a manner that was visible to staff.
Also, as been seen across the country, there are numerous issues related to student behavior and what many teachers see as a lack of discipline, an absence of empathy among students, and a variety of other issues related to politicians, parents, and culture wars marching further into the classrooms.
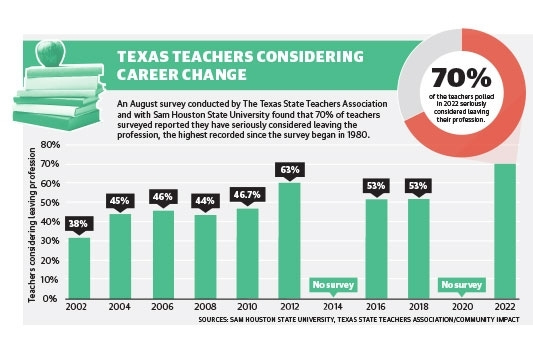
With these in mind, Conroe ISD, like many other school districts in the U.S., is facing a teacher staffing crisis. So much so that the CISD Superintendent was given direct hiring power by the Board in March to help speed up the process.
This brings us to our focus for today:
Is there anything school districts can do to improve teacher morale locally?
There are likely many studies being performed all over the country on teachers and public education. For today, we are trying to focus on what school districts may have the most control over, which is local campus climate and how teacher morale is both tracked and improved upon.
Putting aside anecdotes, social media trends (e.g., #teacherquittok), and constant news stories about a teacher exodus, we must rely on the tried-and-true method to evaluate teacher job satisfaction. Let’s look at the data.
Organizational Health Instrument
Each year, schools in Conroe ISD take part in the Organizational Health Instrument (OHI) survey, which collects this type of ‘job satisfaction’ information, as well as much more data that we will expand upon. Around December to January, each school schedules a meeting for all staff to complete this survey. They are huddled into a room, each provided a paper scantron with questions, and they fill out the survey individually. The scantrons are completed anonymously, proctored by a member of staff to oversee their completion. Once finished, these scantrons are stuffed into an envelope, sealed, and sent to district administration. Each school in Conroe ISD does this, and likely every school in the United States does some form of OHI.
Due to proprietary information, I could not obtain a copy of the actual forms used by Conroe ISD. However, I did find something similar online:

These scantron packets are then sent to and reviewed by the third-party who manages OHI (more on them later). That company provides summaries back to the district for each campus, which includes raw data and percentile scores, and then decisions can be made on that information by district administration and local school admins.
Principals and assistant principals also complete these surveys as a means to gauge their own perception of what they expect staff will score. This helps find gaps where the local admin believe issues are compared to staff, and it shows if they are in sync with the school (or out of touch).
After a few months, once the OHI data is received, reviewed, and plans made between district and local admins, staff at each school receive a presentation at the end of the school year from their principal. This is where they discuss their OHI scores and see which areas they are strong or need improvement.
The differences we have seen is between campuses, in that some admin proudly present their actual scores (e.g., 98% percentile OHI), whereas others only share certain information like top three or bottom three scores. Some discuss with full transparency…where others may not.
The area we would like to know is how OHI is applied from beginning to end, and if this data is used to improve areas such as teacher morale.
What is the purpose of the OHI survey?
What is the process for how data is collected and shared?
Who reviews this data?
Who makes the decisions and is accountable to act upon this data?
Does the School Board have insight into overall OHI scores for the district?
Does OHI results drive policy in the district?
The questions keep creating themselves the deeper you go. To begin, let us start from the beginning with everyone’s favorite topic.
Literature
There is no shortage of papers written about the impact of campus climate and student achievement; it is a common topic for education PhD students. In fact, after speaking with Dr. Null, Superintendent for Conroe ISD, I learned that he himself wrote his PhD dissertation on the subject of campus climate. It is titled “The Impact of an Economically Disadvantaged Student Population on School Climate”. Here is an excerpt from the abstract:
This quantitative study examined the results of the 2010 administration of the Organizational Health Inventory (OHI) within a large, Texas, suburban school district in relation to the percentage of economically disadvantaged students in the sample schools…
…The results of the study indicated that campus climate was significantly affected by students’ SES status…
…Post hoc analysis indicated that campuses with greater than 70% of students identified as economically disadvantaged were most likely to experience a negatively affected school climate.”
I learned that Dr. Null is quite the data enthusiast, in that he likes working with data and discussing it, and his dissertation confirms that. He also references how important local leadership is at the campus level, as well as modern leadership skillsets such as instructional and transformational leadership. I was also happy to learn some new things like Social Cognitive Theory.
There was another PhD dissertation I read that focused on OHI and student achievement (Carla Brosnahan, 2011). The summary of this one was quite interesting, emphasis mine:
Healthy schools exhibit the following characteristics:
The goals of the school are clearly stated and supported by the principal and staff.
The staff communicates vertically and horizontally. Information is relatively distortion free and accurate.
The school has a balance of power between administrators and staff. Staff feels they have influence in decision making.
The staff is cooperative in distributing the workload. The leaders know and use the talents of their staff.
Team members want to be a part of the team and school.
The staff has a sense of satisfaction and well being.
The staff feels free to take risks. Creativity is encouraged.
The staff feels free to fulfill their roles and responsibilities.
The school staff tolerates stress and remain stable while coping with external demands.
Problems are identified and solved with minimal energy.
Research has shown that the person that can make the most difference in the direct education of children is the classroom teacher. In addition, the principal sets the tone and influences the school climate.”
There are government-sponsored studies and entire sets of books written on organizational health that is specific to public education that goes back decades. It is well understood that campus climate can positively or negatively affect student achievement. After reading even a few of these papers, it becomes obvious why schools would need to know how happy their teachers are. Cohesion between teachers, and from teachers to admin, is vital to create a climate in which students can learn and achieve.
Let’s move on to the application of OHI.
The Diagnostician
Conroe ISD has been using the same company to perform its OHI surveys for over 30 years. They are appropriately named Organizational Health Diagnostic & Development Corporation (OHDDC), website here, and are based out of Flower Mound, TX. Their overall strategy seems sound to me, as someone who has never done such work. Here is their promo video (1 min 24 sec):
Their process is built upon 10 ‘dimensions’ that was created in the 1960s (here) by a Dr. Matthew Miles from Columbia University. In the OHI survey that staff complete, there are eight questions per each dimension, giving 80 questions total, each asked using a Likert scale as seen in the sample survey we saw earlier.
Here are the 10 dimensions:
Goal Focus is the ability of persons, groups, or organizations to have clarity, acceptance, support, internalization, and advocacy of goals and objectives.
Communication Adequacy exists when information is relatively distortion free and travels both vertically and horizontally across the boundaries of an organization.
Optimal Power Equalization is the ability to maintain a relatively equitable distribution of influence between leaders and team members.
Resource Utilization is the ability to coordinate and maintain inputs, particularly personnel, effectively with a minimal sense of strain.
Cohesiveness is the state when persons, groups, or organizations have a clear sense of identity. Members feel attracted to membership in an organization. They want to stay with it, be influenced by it, and exert their own influence within it.
Morale is that state in which a person, group, or organization has feelings of well-being, satisfaction, and pleasure.
Innovativeness is that ability to be and allow others to be inventive, diverse, creative, and risk taking.
Autonomy is that state in which a person, group or organization has the freedom to fulfill their roles and responsibilities.
Adaptation is that ability to tolerate stress and maintain stability while coping with the demands of the environment.
Problem-solving Adequacy is an organization's ability to perceive problems and solve them with minimal energy. The problems stay solved and the problem-solving mechanism of the organization is maintained and/or strengthened.
I contacted Dr. Marvin Fairman, founder of OHDDC, and the lead for the team that developed the OHI. He is well-known in the organizational health space, has written multiple books on the subject, and is extremely knowledgeable on the topic from his decades of experience. He sent me documentation about how OHI was developed, as well as an Executive Summary packet that expands upon principles of leadership.
Dr. Fairman’s books are on my list to read, so we may deep-dive the science behind OHI in another post. As we discussed earlier, we know collecting this data is vitally important for improving student achievement and helping to focus development for growing better leaders across all levels in an organization. From my reading, I believe the OHI that Conroe ISD uses is well developed and a great method for data collection relating to campus climate.
My curiosity with Dr. Fairman and OHDDC was their interactions with school districts and the process for which data is collected, analyzed, and shared.
The Report
Once completed, the final OHI data is put into a binder for each campus, providing detailed insight into their scores, breaking down the 10 dimensions and their impact. The report is filled with line and bar graphs, including one comparing the previous year to the next, as seen here:
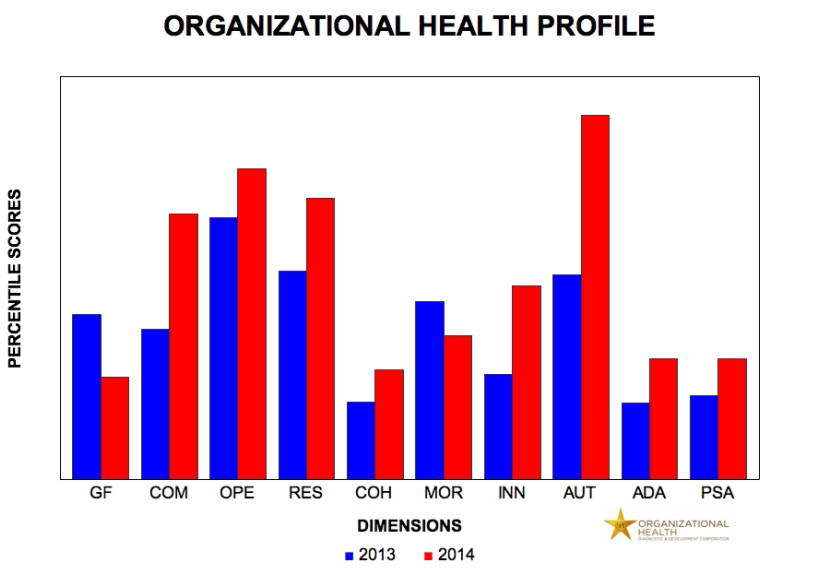
An average percentile is taken for each of the 10 dimensions, and comparisons are made against the rest of the country (within OHDDC’s dataset), giving you your final score (e.g. 78% percentile OHI).
This final score is generally what school staff are interested in.
For example, if anyone is familiar with Clark Intermediate in the Grand Oaks feeder zone, the mantra of the entire campus is “the happiest place on Earth”. This is for good reason, because they have some of the highest OHI scores in the district.
Perhaps one day we can sit down with their principal to better understand how she has achieved this. From speaking with her on a few occasions, I can say she is welcoming, shows great empathy, and has a very clear, transparent way of communicating to her staff. She recently accepted a new position at York Junior High, a school that many know has had numerous challenges over the years. It should be interesting to see how she can turn things around.
Conroe ISD Data
After several email, phone, and in-person discussions with Dr. Null, whom I truly appreciate for being so accessible, I learned that the raw OHI data is actually difficult to use without the context of each campus, within that school year, compared to their student scores, or even what mood the staff were in the day they took their survey.
My IT brain needs logical answers, but OHI is one piece of data of a whole that is mostly useful for each campus individually. OHI data isn’t even meant for teachers. It’s for principals.
You see, the entire OHI process is to help build leaders. It is a coaching tool. The data is used every year to show where improvements must be made, but those 10 dimensions flow up and down every year. You may be able to correlate trends over 2-3 years, but when you work in a business where your customers (i.e., students) change every year, and your well-being is at the whim of politicians, data can skew hard in any direction.
As we learned earlier, you can use OHI data for research, which could be focused on teacher morale. Yet its relevance would be short lived, adding to the plethora of what we already know from decades of research:
Happy teachers equals higher student achievement.
Dr. Null did show me relevant data around the different grade levels, such as overall OHI for high schools, intermediate, and elementary. There was a clear trend showing that CISD intermediate schools had lower numbers on average over the last several years, and this was understood by the admin that those schools are understaffed. They are already working to address this. So the data can show some trends.
Even after seeing a sample of the data, and understanding the purpose and process of OHI, I have not decided if I am satisfied with the answers I have collected so far. There is more we can do with this data.
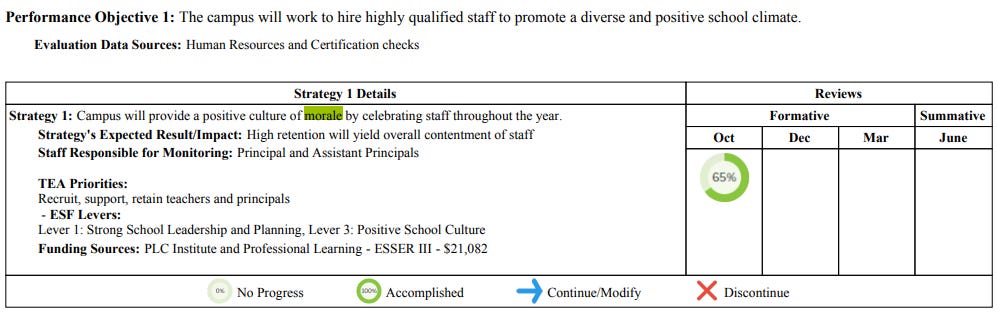
Improvement Planning
The closest public reports I could find on district OHI results are found in Campus Improvement Plans (CIP). These are the plans partially created from OHI data and are created by a per-campus committee each year. These are usually finished before the end of the school year, in prep for the following year, and then shared with the public sometime in the fall, providing an update on their progress.
A few teachers I spoke with felt that CIPs were a “checkbox”, and that often the goals created within them were largely ignored by local administrators. However, my personal observation is that schools with higher OHI (that I know of) seemed to have more robust improvement plans; as we are seeing, it depends on the campus.
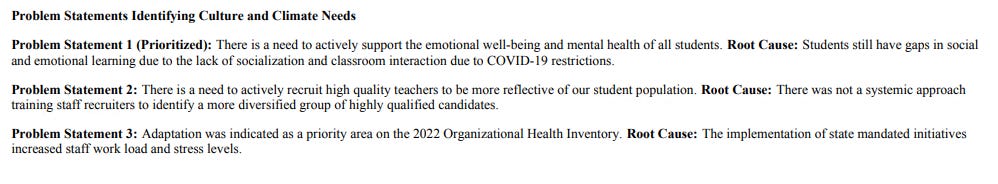
For Conroe ISD, CIPs for each school can be found here. Many include data from OHI, which can be shared as part of problem summaries:
“Wilkinson scored in the 51st percentile in the domain of Adaptation on the OHI.”
A detailed description may use more mumbo jumbo:
“The organizational health survey shows that 1 of the ten dimensions of Organizational Health scored at the Interdependent level, 8 at the Independent level, and 1 at the Dependent level. The three highest dimensions were goal focus, at the 71 percentile, communication adequacy at the 66 percentile, and optimal power equalization at the 63 percentile. The three lowest dimensions were cohesiveness at the 27 percentile, and adaptability at the 40 percentile.
This is where you will see slightly different approaches between schools when listing the Problem Statements or Goals sections.
Campus Improvement Plans is where OHI data, including teacher morale, is applied.
The Board
Now that we know what OHI is, how data is collected, and how it is used by the district, our next question is how does the School Board consume this data? What do they know about teacher morale in the district?
They do not consume OHI data.
At least not directly.
I spoke with a few Conroe ISD Board Trustees: Skeeter Hubert, President, and Misty Odenweller. Skeeter has been on the Board for almost 10 years, and Misty for about seven months.
As President, Skeeter highlighted the importance of the Board’s partnership with the Superintendent, and that all employee related matters are trusted to the administration. The Board must maintain the 30,000 ft view, focusing on policy that drives student achievement in concert with the Superintendent. Skeeter instead prefers to check-in with personal visits to schools, talking with teachers and administrators directly, which he does often at school events.
I see the value in this approach, in that if there is too much interference between the Board and employee issues, you quickly get into micromanagement of the district, which would not be conducive to a good relationship with the Superintendent and their teams.
Skeeter does want to drive change for teachers and Texans as a whole. He recently announced his run for the Texas House District 15, currently represented by Steve Toth.
Trustee Misty Odenweller sees opportunities in understanding why teachers are leaving the profession. As a former teacher herself, and with multiple family members being teachers, she is acutely aware of the challenges that educators face. She would like to understand teacher morale from a high level and see the data being collected. She asked questions that sparked my interest, such as “Do teachers complete an exit interview in Conroe ISD?” They do not. In fact, when a teacher puts in for resignation in CISD, the ‘why’ question is one field in the form, and when they click submit it goes directly to the school principal, which could be the person causing them to resign.
Misty believes teachers do not have a voice in the district. Based on our personal experience, I agree with her on this topic.
Dr. Null did explain how OHI data can make it to the Board, which is usually when issues are needing to be addressed at a policy or staffing level. OHI appears to be as needed information for the Board.
This is where my curiosity spiked on the topic, because employee morale data would absolutely seem like something the Board would be interested in. But do they need to consume this data? What would be the benefit or downside to them having this information?
When I spoke with Dr. Fairman about OHI results, I asked the question on if he provided data or presented to Boards as well. He said there are some Boards that request and receive summary presentations.
I recently read The Essential School Board Book by Nancy Walser. The author focuses on high-performing school districts and how they operate to improve student achievement. My highlighter almost ran out while reading this book; here are some key excerpts:
“Board members need to know enough about the work of educators seeking to raise achievement to be able to assess their efforts, support them, and communicate about them, without dictating what should be done. They need to have enough information to make good decisions without being overwhelmed.”
“In the age of accountability—where educators are looking at and comparing results of classroom, district, state, national, and even international assessments—there is no shortage of data to be had. The real challenge for school boards and superintendents is to figure out what kind of data the board needs to fulfill its governance role. Those who work with school boards to set up accountability, monitoring, and evaluation plans say boards need to use different sets of data than others working in a district to keep an eye on the big picture.”
Based on what we’ve read up unto this point, school boards should absolutely have a high-level insight into OHI data. If anything, it gives them an understanding of the process and how the data is used to improve campus climate each year.
Summary
Anyone with a teacher in their family knows how difficult the profession has become. This is not a local phenomenon, but it is unclear if there are states and school districts weathering these challenges better than others.
Conroe ISD uses the Organizational Health Instrument to collect valuable survey data per campus that includes teacher morale and overall campus climate. This data is managed solely within district administration, pushed down to the local campuses to build improvement plans to make changes where needed. This occurs every school year.
Teachers and staff are not always privy to their OHI scores, and as the data can be used for assessments of principals, it is not provided to the public. Although I understand why this data is kept private, I can see the value on at least sharing the summary data with campus staff.
The Conroe ISD School Board does not consume OHI data directly, relying on the Superintendent and his team to manage their employees. Therefore, outside of personal visits and discussions with teachers, we can assume they are not aware of any systematic issues related to teacher morale and campus climate based on OHI data alone, unless it is communicated by the Superintendent and addressed as part of recommended policy changes.
Conclusion
We began trying to understand OHI within Conroe ISD because it collects data on teacher morale and a plethora of other valuable data that the district uses to inform its leaders (local and administrative) on where it needs to improve. This data may be the only set of yearly metrics that can show validation of what we are seeing in person - a teacher staffing crisis in process, driven by low morale and lack of support.
I believe there is an opportunity to use this data in a better way, which I am thinking about in another post (e.g., democratize the data).
Let’s close out by looking at this from the teacher’s perspective:
School districts are constantly working to keep everyone happy, engaged, and students performing well. The fact it collects data from staff to make improvements is great, and it gives district and local admin more tools in their toolbelt to address issues year to year.
On the other hand, OHI is not meant to solve core, institutional level issues, which we know is really a debate on the Texas public education system.
My personal opinion as an outsider, and I know there are those that work in the district who will disagree, is that student achievement is given too high a priority over the well-being of employees. If your school has a 98% OHI, it gets recognized as long as student scores are high as well. If your school has a 2% OHI, and scores are high, then you still get the same recognition, perhaps with some adjustments.
This is an oversimplification of what district admin does, but from a teacher’s perspective, this is how it appears. Happier teachers may mean higher scores, but their happiness is not required. A principal that runs a school like a boot camp may get similar STAAR test scores as compared to “the happiest place on Earth”. Short of HR stepping in to address complaints, nothing changes as long as that school is performing well.
When I think back to my 13-year-old self, a scrawny kid strapped to a horse and plow being dragged down never-ending lines of the potato garden, I remember feeling the dread every time that horse turned around for the next row.
Every year teachers go into work with less support, less resources, and in an increasingly politicized environment. Outside of voting in elections, we must do more to drive better campus climate and overall teacher morale. We must support school district policy that improves their well-being, their sense of purpose, and their career growth. OHI data may be useful for understanding teacher morale, but little will change their current work experience until their happiness is made a priority at a district level.
What are we doing as a district about teacher morale in Conroe ISD? What can we do?
As a former CISD teacher of 15 years, Misty’s comments are spot on. Teachers are not listened to in the district. I’ve worked for a principal that was the best of the best, and then watched as her successor ruined what was over a fabulous school. I’ve seen OHI used effectively and I’ve seen it weaponized against teachers, creating more (forced) work and responsibilities outside of school hours in the name of “leadership opportunities”. In my experience, state level edicts, while frustrating, are easier to bear than directives coming from the district or school administration, especially when those things create more paperwork for teachers with little too no benefit to students. CISD has been adding and creating more district and campus level positions (including instructional coaches) that do not deal directly with students in the last few years., despite campuses having to share dyslexia specialists that work directly with students and many elementary and intermediate campuses not having a full time security officer. The work of these people seem to be to come up with more things for teachers to do and has lead to more micromanaging. The increase in micromanaging has lead to a decrease in scores at the school where I taught. No one is addressing the root causes. Instead they come at teachers with new programs saying “don’t worry, this doesn’t replace anything you’re already doing” (meaning fit this extra thing into your already full day). I could go on, but I’ll just add that when my grade level has the highest benchmark scores in the district, no one came to us to ask what we were doing right (except a couple teachers from a neighboring school). Interesting considering we were a very high performing school for many years.
Great article with important questions. You are on the right path! The majority of teachers are not leaving the field for any bigger reason than an overwhelming sense of frustration, disappointment, and hurt at their treatment in day-to-day interactions on their campus and the fear of reprisals and intimidation of retaliation constantly present if we even remotely attempt to speak our truth. I highly recommend a quick 16-minute listen to this podcast about Artificial Harmony and the damage it germinates! Teachers are punished if their passion and concern for kids and the state of education leads them to speak out because, in part, there is a history of systematic desire and reward for ARTIFICIAL HARMONY in place in most schools/districts. https://tinyurl.com/2rdwsr2f